Correlation
ABOUT OUR PROJECT
The title of our project is Anxiety and Hopelessness among Undergraduate Students of IIUM.
Hypothesis: There is a statistically significant relationship between the levels of anxiety and the levels of hopelessness of IIUM students.
Scales used to measure:
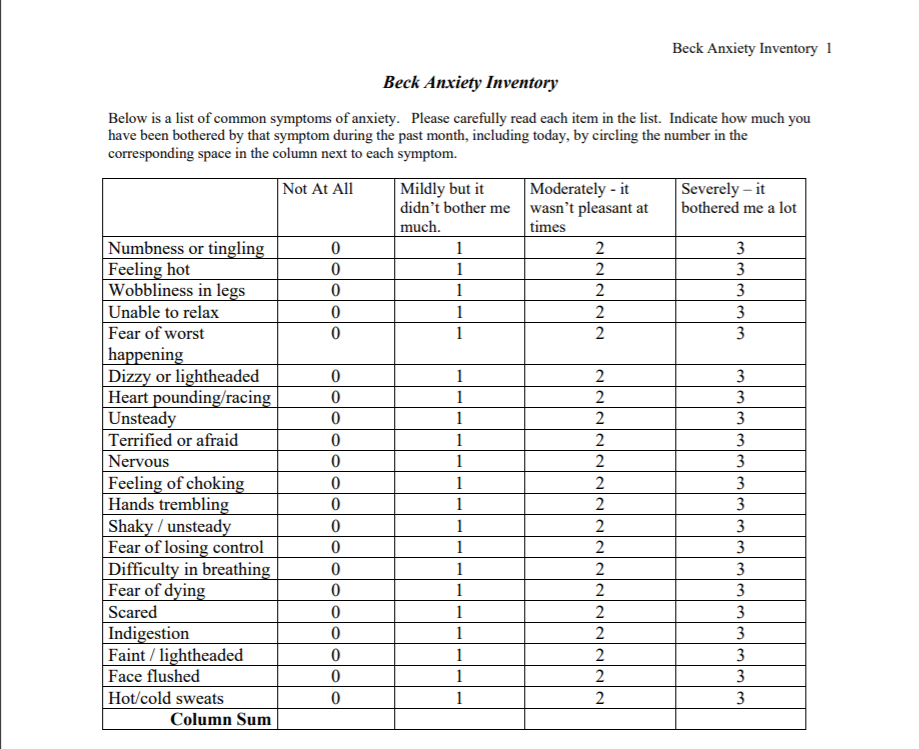
1. Beck's Anxiety Inventory
1. Beck's Anxiety Inventory
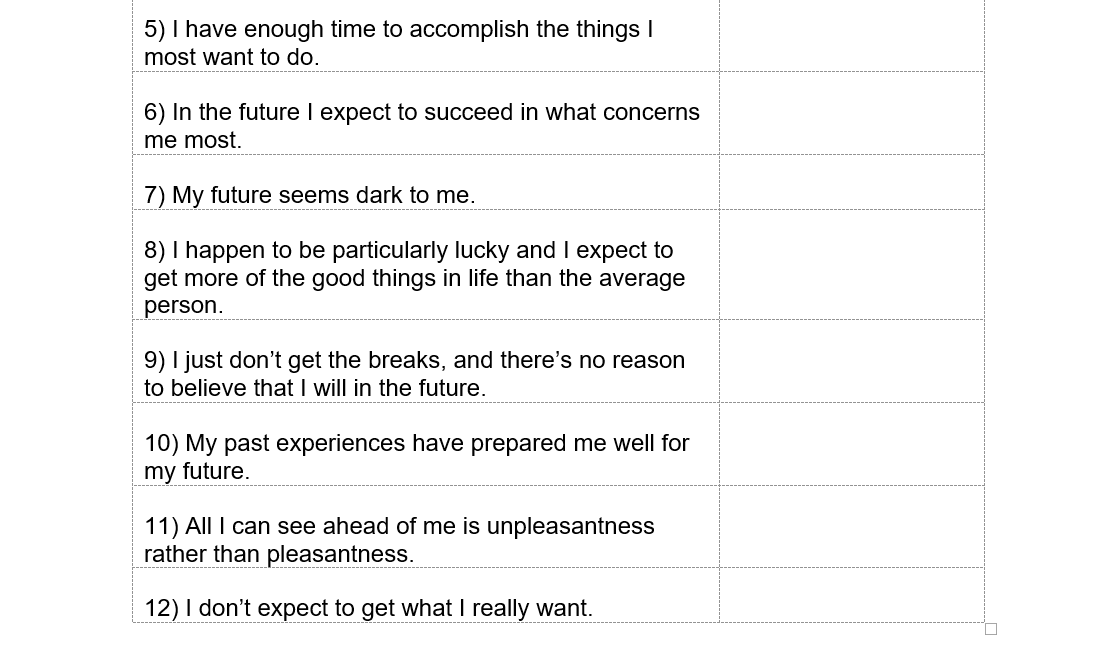
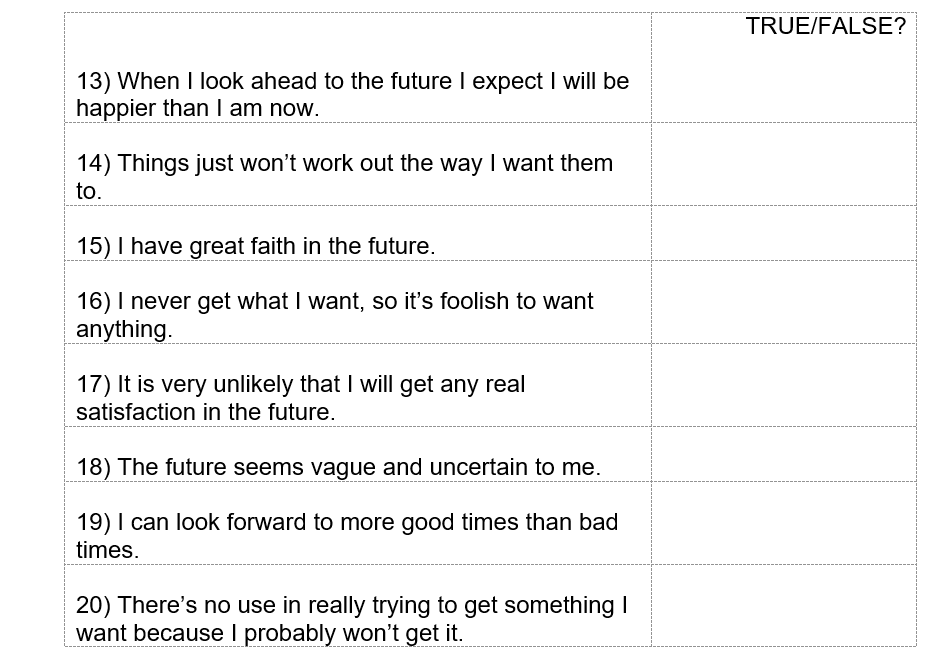
2. Beck's Hopelessness Scale

1. Coding Strategy
We coded both the demographic questions and the variables by clicking on Variable View and editing the variables.

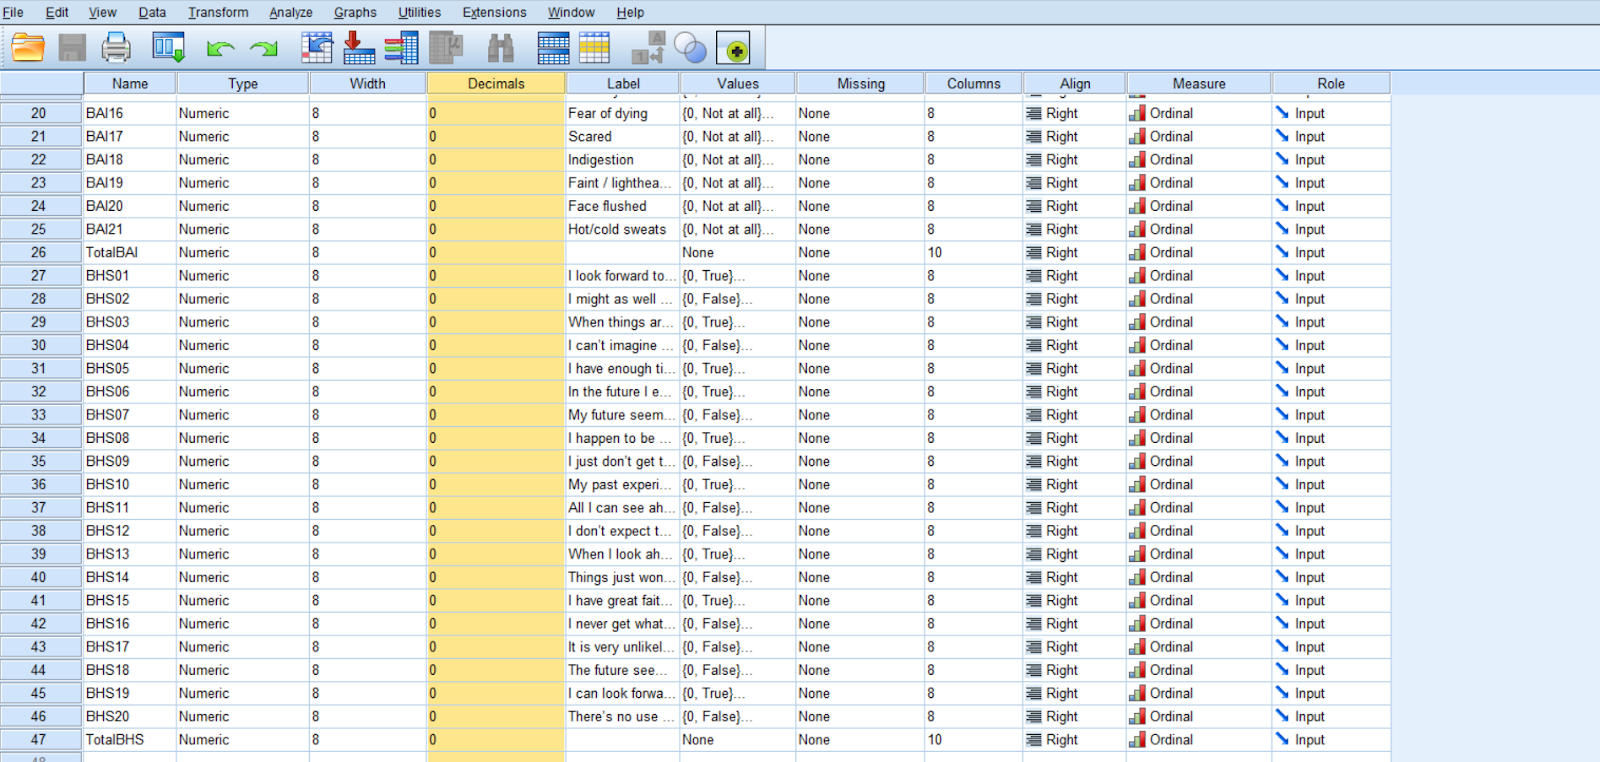
The figures above shows the variable view of our data sets. The variables was coded in accordance to the scales we have chosen. For the Beck’s Anxiety Index (BAI), participants’ answers is measured through the use of a 4-point Likert scale where 0= Not at all, 1= while the Beck’s Hopelessness Scale (BHS) uses a scoring sheet method where the participants were given two choices of answers where the correct answer were given the value of 1 while the wrong answer were given the value of 0.
2) Datafile
After coding our variables, we return to data view and keyed-in the data we’ve obtained into a datafile.
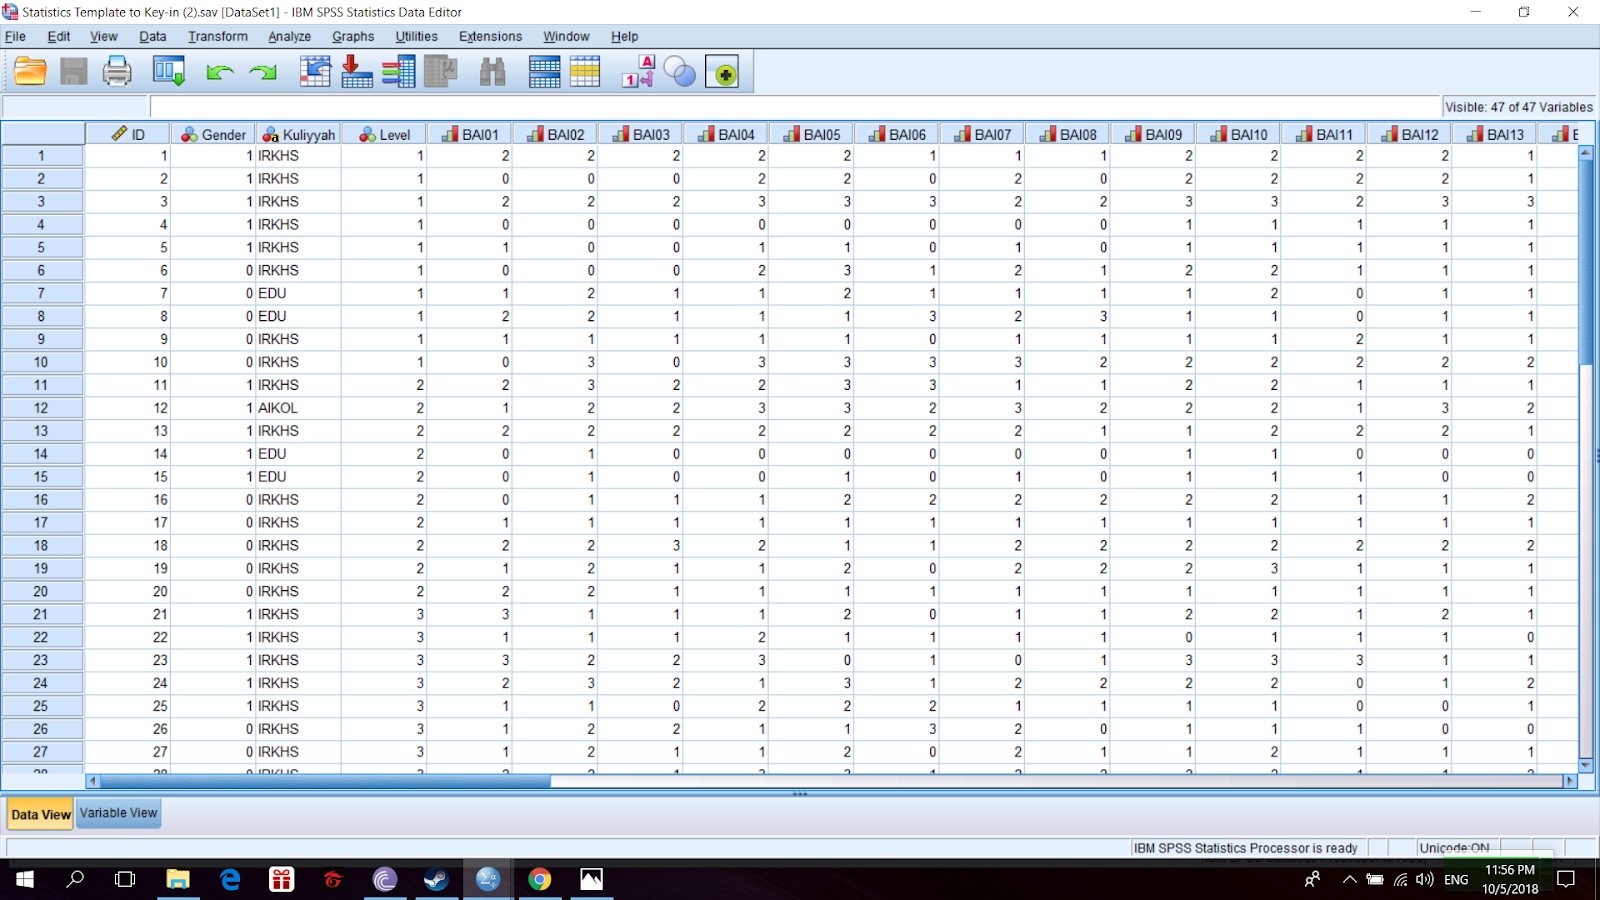

The figures shows the completed version of the datafile. The total score for both scales were also calculated and
recorded in SPSS by clicking Transform > Compute Variable.

A window such as the one in the figure above will pop up which allows us to total up the scores for both scales.
The total score for the Beck’s Anxiety Index (TotalBAI) were calculated by using the following equation:
TotalBAI = BAI01 + BAI02 + BAI03 + BAI04 + BAI05 + BAI06 + BAI07 + BAI08 + BAI09 + BAI10 +
BAI11 + BAI12 + BAI13 + BAI14 + BAI15 + BAI16 + BAI17 + BAI18 + BAI19 + BAI20 + BAI21
The total score for the Beck’s Hopelessness Scale (TotalBHS) were calculated by the following equation:
TotalBHS = BHS01 + BHS02 + BHS03 + BHS04 + BHS05 + BHS06 + BHS07 + BHS08 + BHS09 +
BHS10 + BHS11 + BHS12 + BHS13 + BHS14 + BHS15 + BHS16 + BHS17 + BHS18 + BHS19 + BHS20
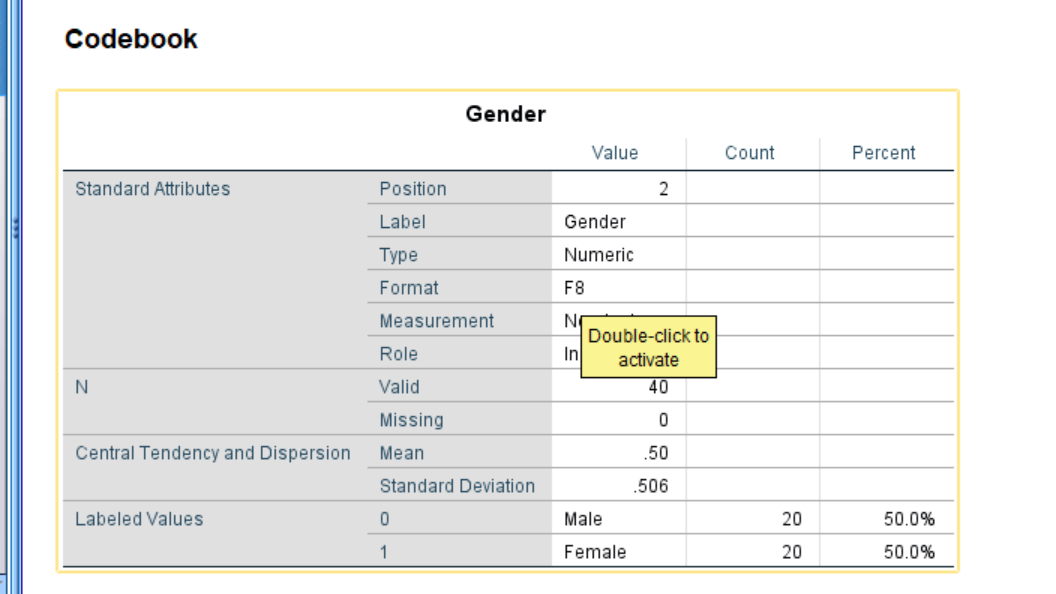
3) Codebook
After we finished keying-in the data, we begin preparing a codebook. This is done by clicking
Analyze > Report > Codebook. We then keyed in the relevant data into the codebook.
Analyze > Report > Codebook. We then keyed in the relevant data into the codebook.

The output will be like this :
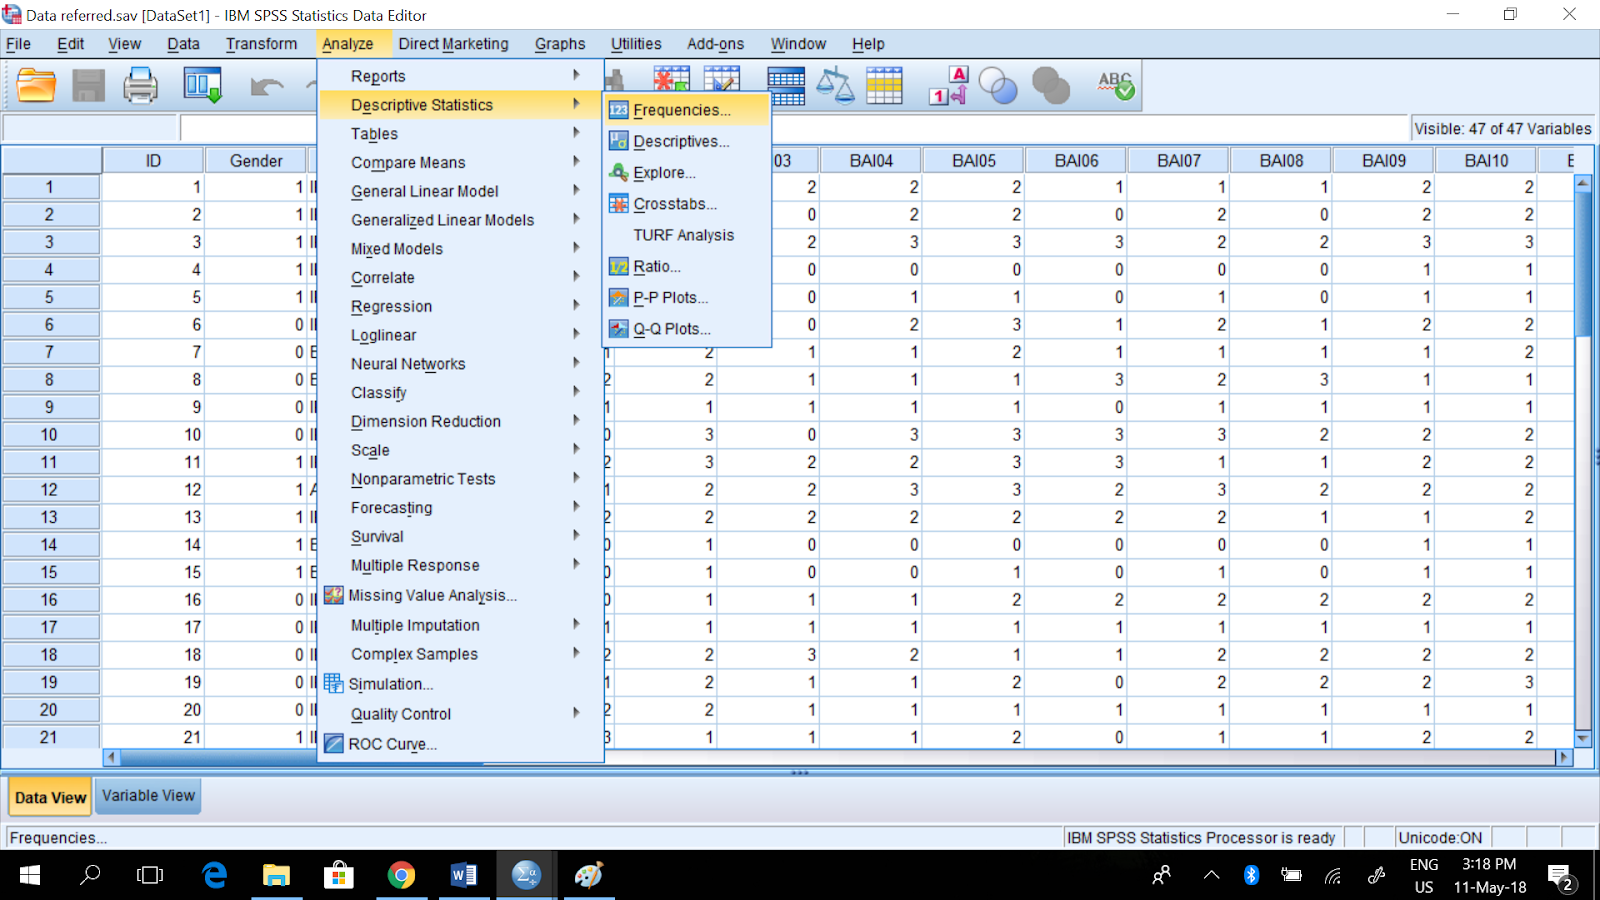
4) Screen, Clean and Prepare the Data
After that, choose variables that we need to the variable column using the arrow. Next, we click ‘OK’ to see if there any incorrect values.


To do descriptive statistics, we click Analyze > Descriptive statistics > Descriptive


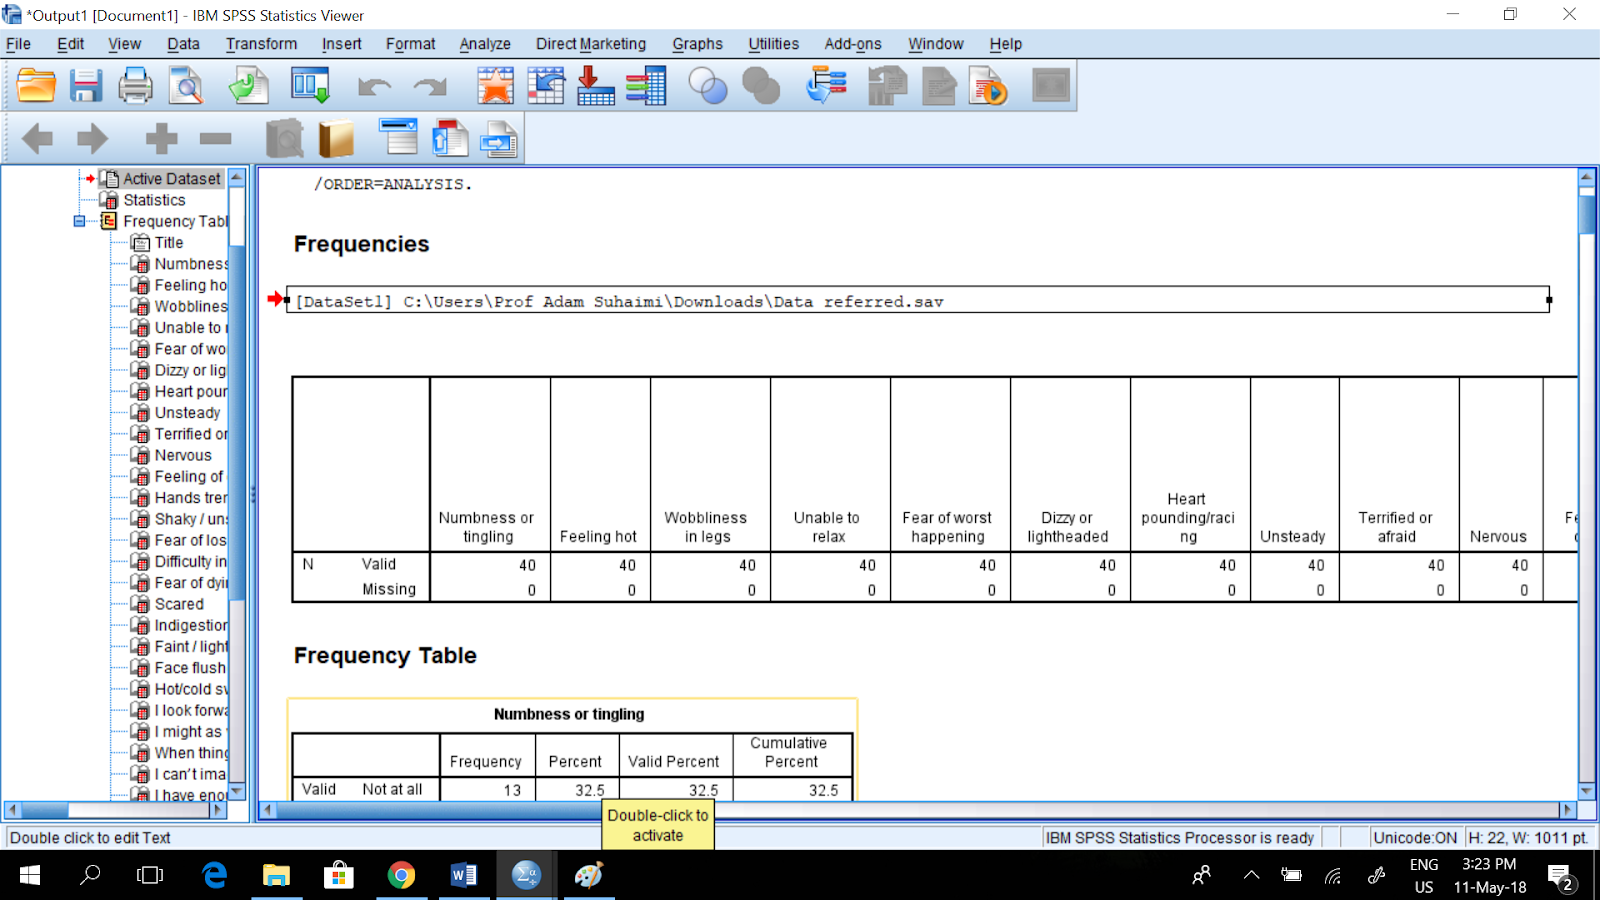
The next step is to screen, clean and prepare. First, click Analyze > Descriptive Statistics > Frequencies
After that, choose variables that we need to the variable column using the arrow. Next, we click ‘OK’ to see if there any incorrect values.
Recheck the output whether we have missing values or not.
It can be seen here we have no missing value.
5) Statistical Assumptions
In statistical assumptions, we will need to click Analyze > Descriptive statistics > Explore.
In statistical assumptions, we will need to click Analyze > Descriptive statistics > Explore.
6) Descriptive Statistics
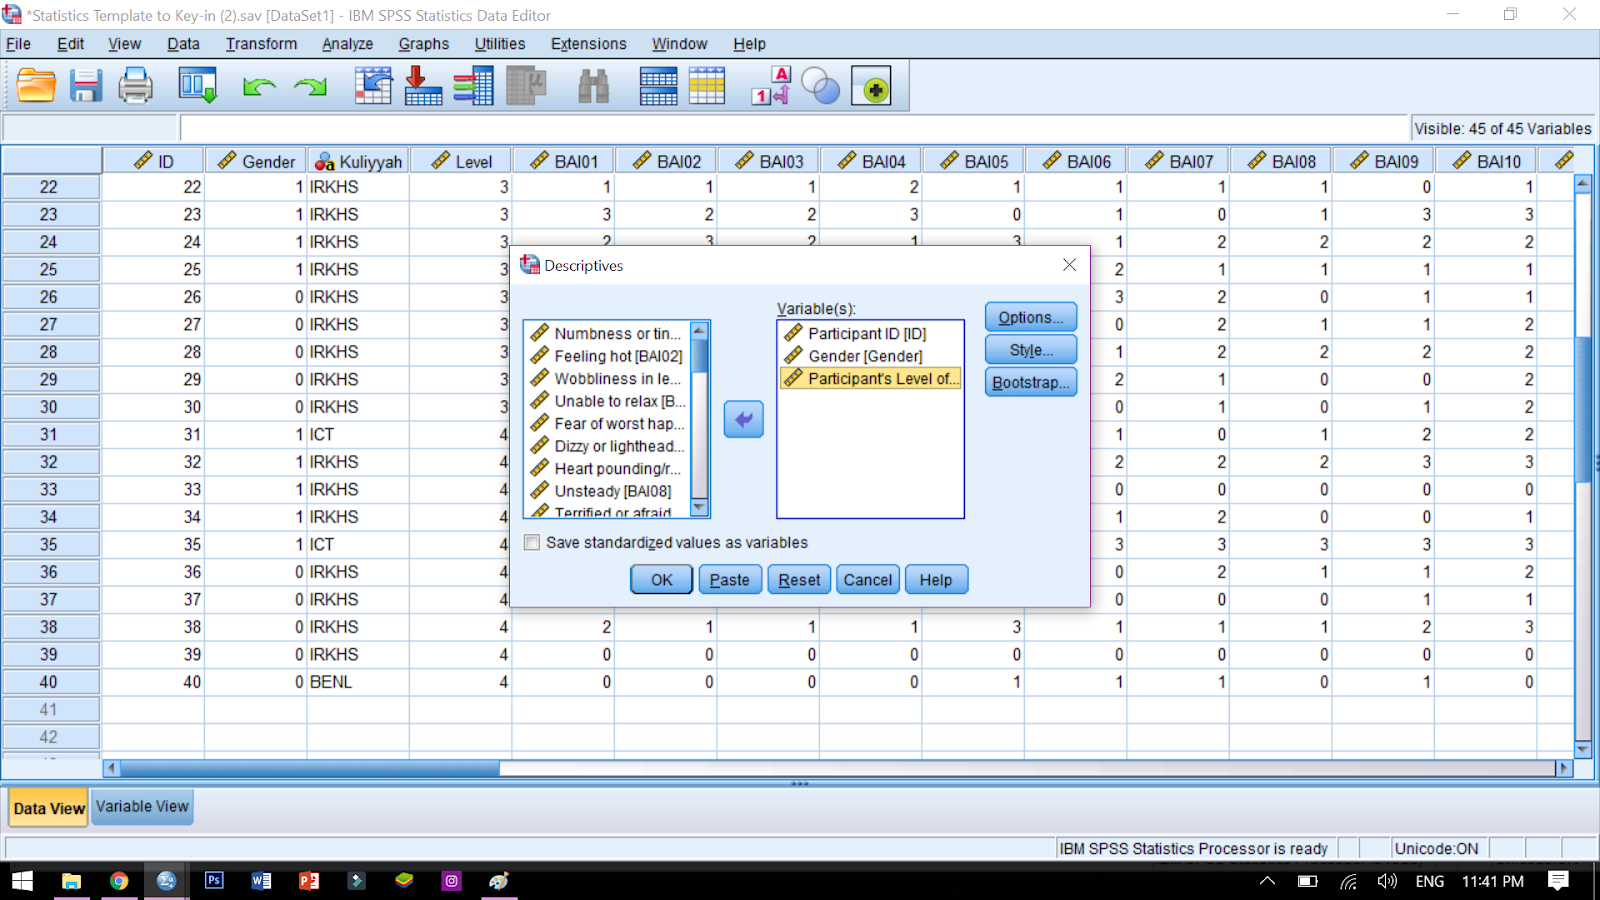
To do descriptive statistics, we click Analyze > Descriptive statistics > Descriptive
Then, put the required items into variables column.
Click on Option and tick the items as shown below.
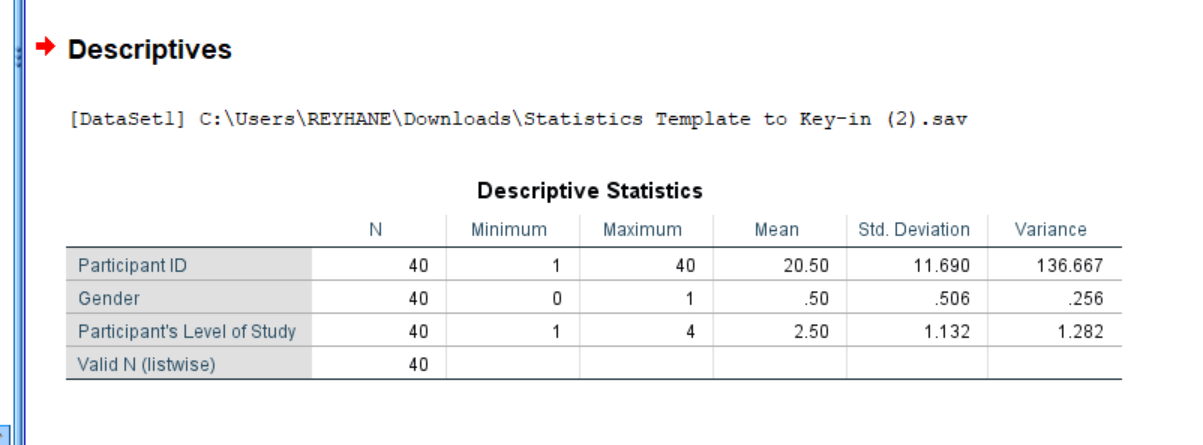
Below is the output of our Descriptive Statistics
7) Correlation
We then proceed to run the correlation test between the total score of Beck’s Anxiety Index (TotalBAI)
and total score of Beck’s Hopelessness Scale (TotalBHS) in order to test the statistical significance
of the relationship between the levels of anxiety and the levels of hopelessness.
We did this by clicking Analyze > Correlation > Bivariate
and total score of Beck’s Hopelessness Scale (TotalBHS) in order to test the statistical significance
of the relationship between the levels of anxiety and the levels of hopelessness.
We did this by clicking Analyze > Correlation > Bivariate

The window in the figure above will pop-up. We inputted the TotalBAI and the TotalBHS
into the variables column on the right in order to run the correlation test.
into the variables column on the right in order to run the correlation test.
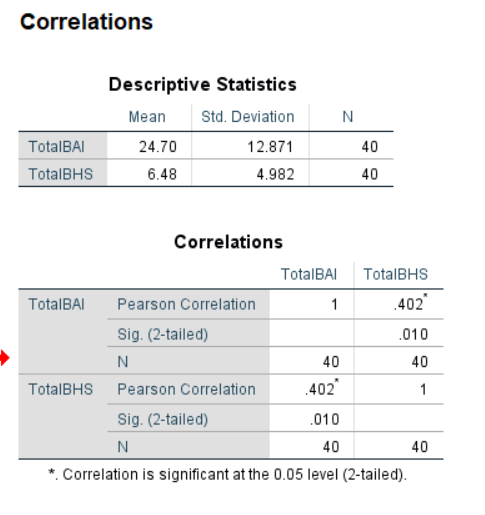
We managed to obtained +0.402 which we compare with the cutoff score of = 0.05
and the df = 40-2 = 38
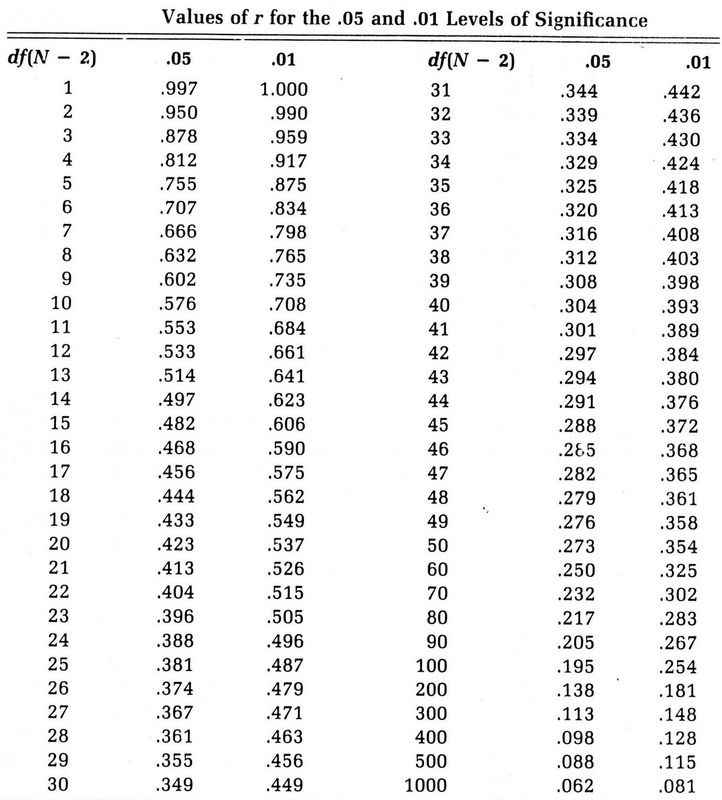
Since +0.402 is more than the cutoff score of 0.312, the result was deemed statistically significant.
We had also ran a scatter plot graph to test the correlation further.

8) Cronbach's Alpha
Click on Analyze > Scale > Reliability Analysis

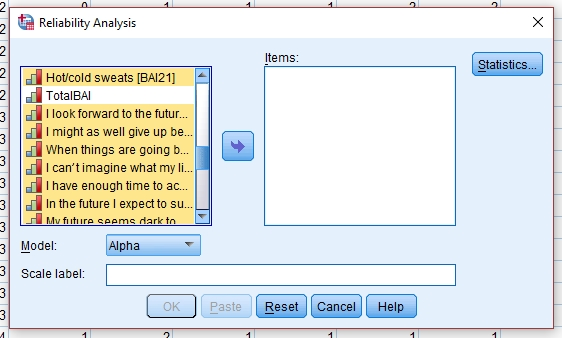


Click on Analyze > Scale > Reliability Analysis
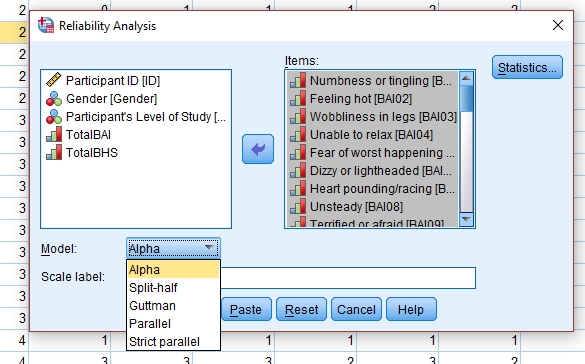
We select the items
Next, we move them to items column
Then, we select what model of reliability to be analyzed.
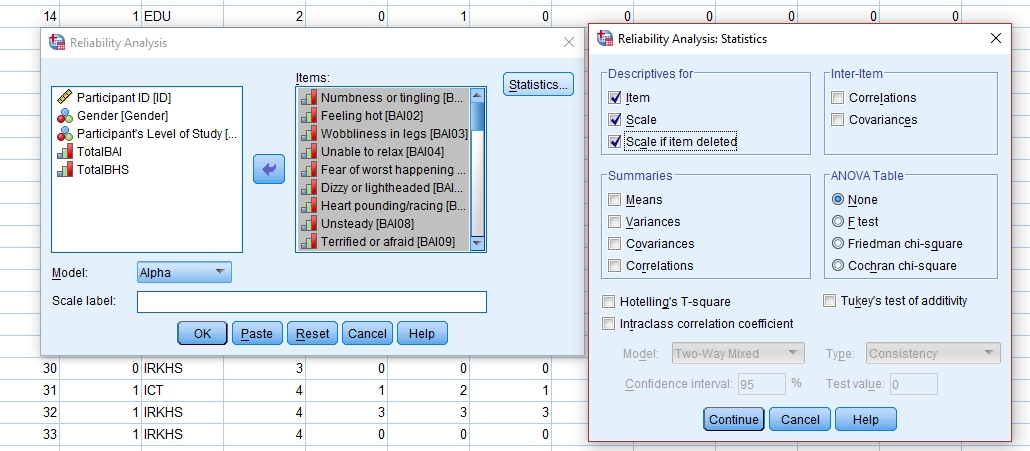
Then, we click on the statistics on the corner of the table and select those referring to diagram above
Case Processing Summary is to identify missing values
Reliability statistics is based on Cronbach’s Alpha value.
The above table is the rule of thumb for Cronbach’s Alpha.
9) APA Format
Comments
Post a Comment